In a stunning election night the Republican nominee for president, Donald Trump, has secured victory after a string of formerly Democratic states including Pennsylvania, Florida, Ohio and Iowa voted Republican.
Nationally, Donald Trump has won 47.5% of the vote, with Hillary Clinton taking 47.7% – yet this has translated into 279 electoral college votes for the Republicans and 228 for the Democrats.
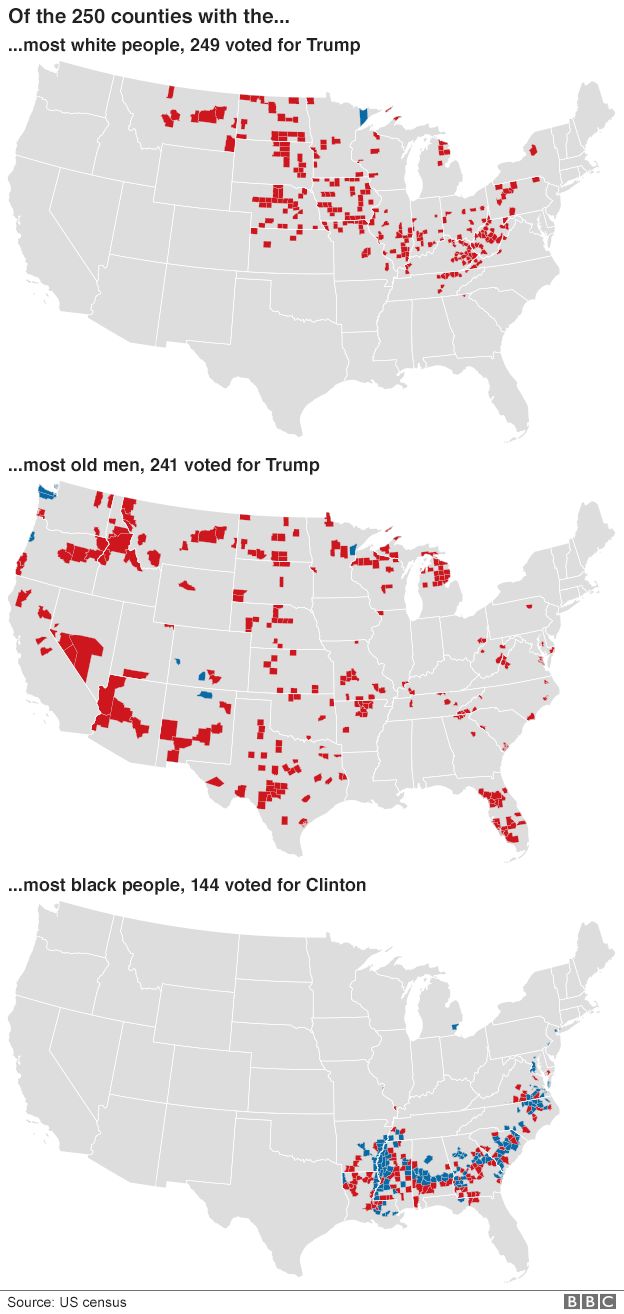
With some states still to declare a result, the map above shows how strong the Republican vote was across the US, pushing Democratic support back to strongholds on the west coast and in the north east.
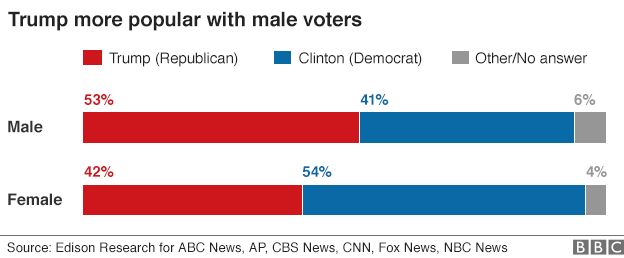
The Democrats lost support in the mid-west and around the Great Lakes, as well as in the south east, with exit polls suggesting that men voted Republican in much higher numbers than women.
The poll of 24,500 people was conducted by Edison Research for ABC News, AP, CBS News, CNN, Fox News and NBC News.
The national share of the vote dropped by more than three points for the Democrats compared with 2012, while the Republican share of the vote increased by less than half a point.
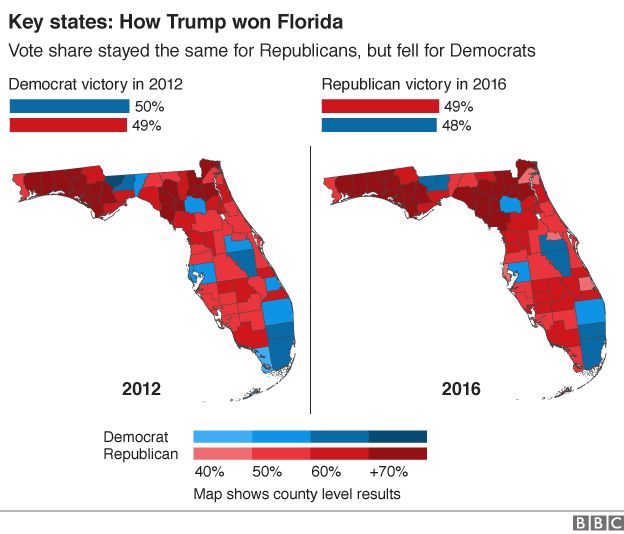
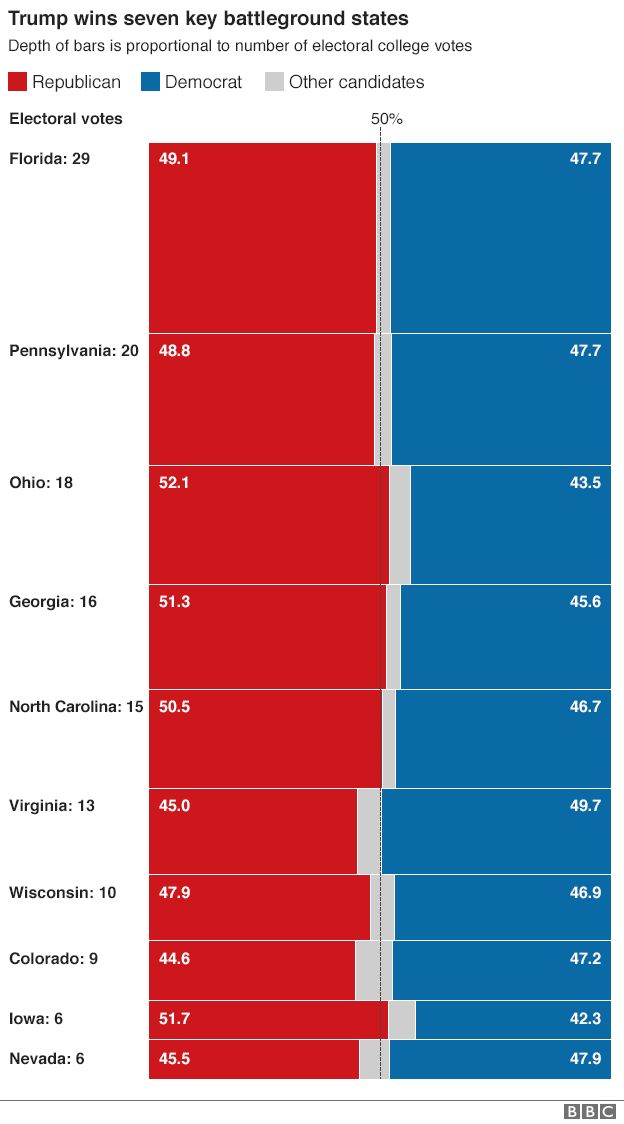
For Donald Trump, taking the key state of Florida, which had previously voted for President Obama twice, was vitally important. However the result was on a knife edge, with the Republican candidate winning by one percent of the vote.
Votes given to other candidates in the state, principally the Libertarian candidate Gary Johnson, would have been enough to clinch the state for Hillary Clinton.
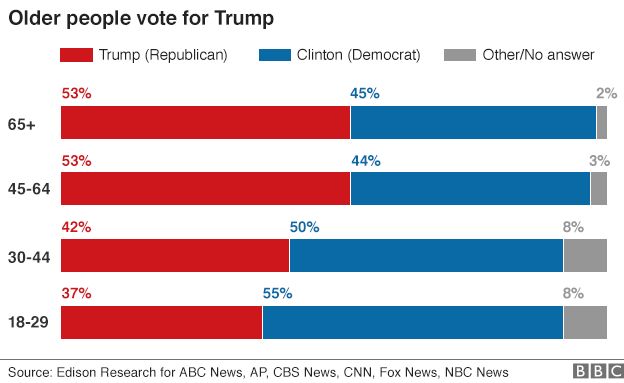
The strong support older voters gave the Republicans will have helped them to win Florida.
Pennsylvania was another striking Trump victory in the battleground states. The state had voted Democrat in the previous six presidential elections.
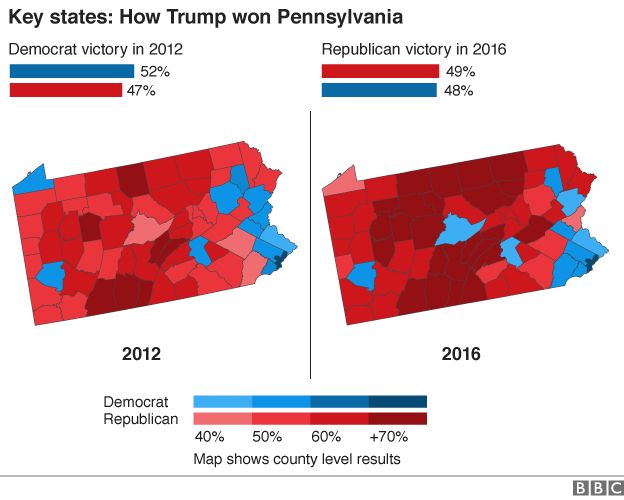
In addition to Pennsylvania and Florida, the president-elect also won in many other of the key states by slim margins, as the chart below shows.
Trump’s electoral victory was underpinned by his success in winning over white voters, with 58% of them voting for the Republican candidate. White voters made up 70% of the electorate in this year’s election.
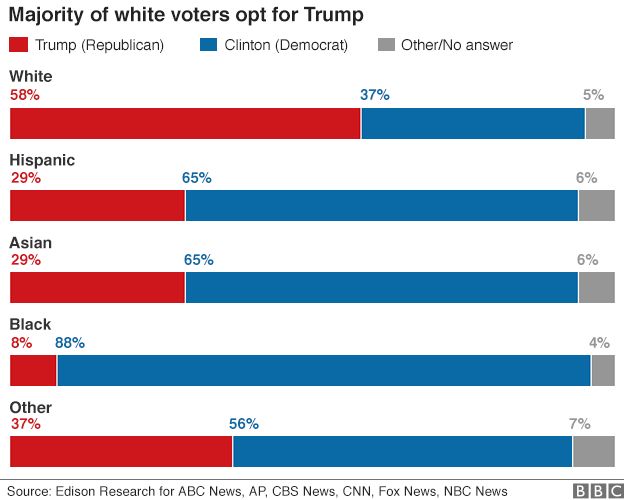
Trump was especially popular among non-college-educated white men, receiving seven in 10 votes from that demographic group and six in 10 votes from non-college-educated white women.
Almost nine in 10 black voters (88%) supported Clinton, compared with 8% who opted for Trump. Barack Obama secured 93% of the black vote in the 2012 election.
A smaller proportion of Hispanic votes went to Clinton than those who voted for Obama in 2012, according to the exit poll.
The above map from the Associated Press shows how each state contributes to the electoral college. The size of states with low populations shrink in the centre of the country while states in the north east with larger populations grow. It helps to give a different perspective on the election results, when compared to the traditional map below.
As well as taking hold of the White House, the Republicans have also retained their majority in both the Senate and the House of Representatives.